
See commodity supply shift before the official numbers.
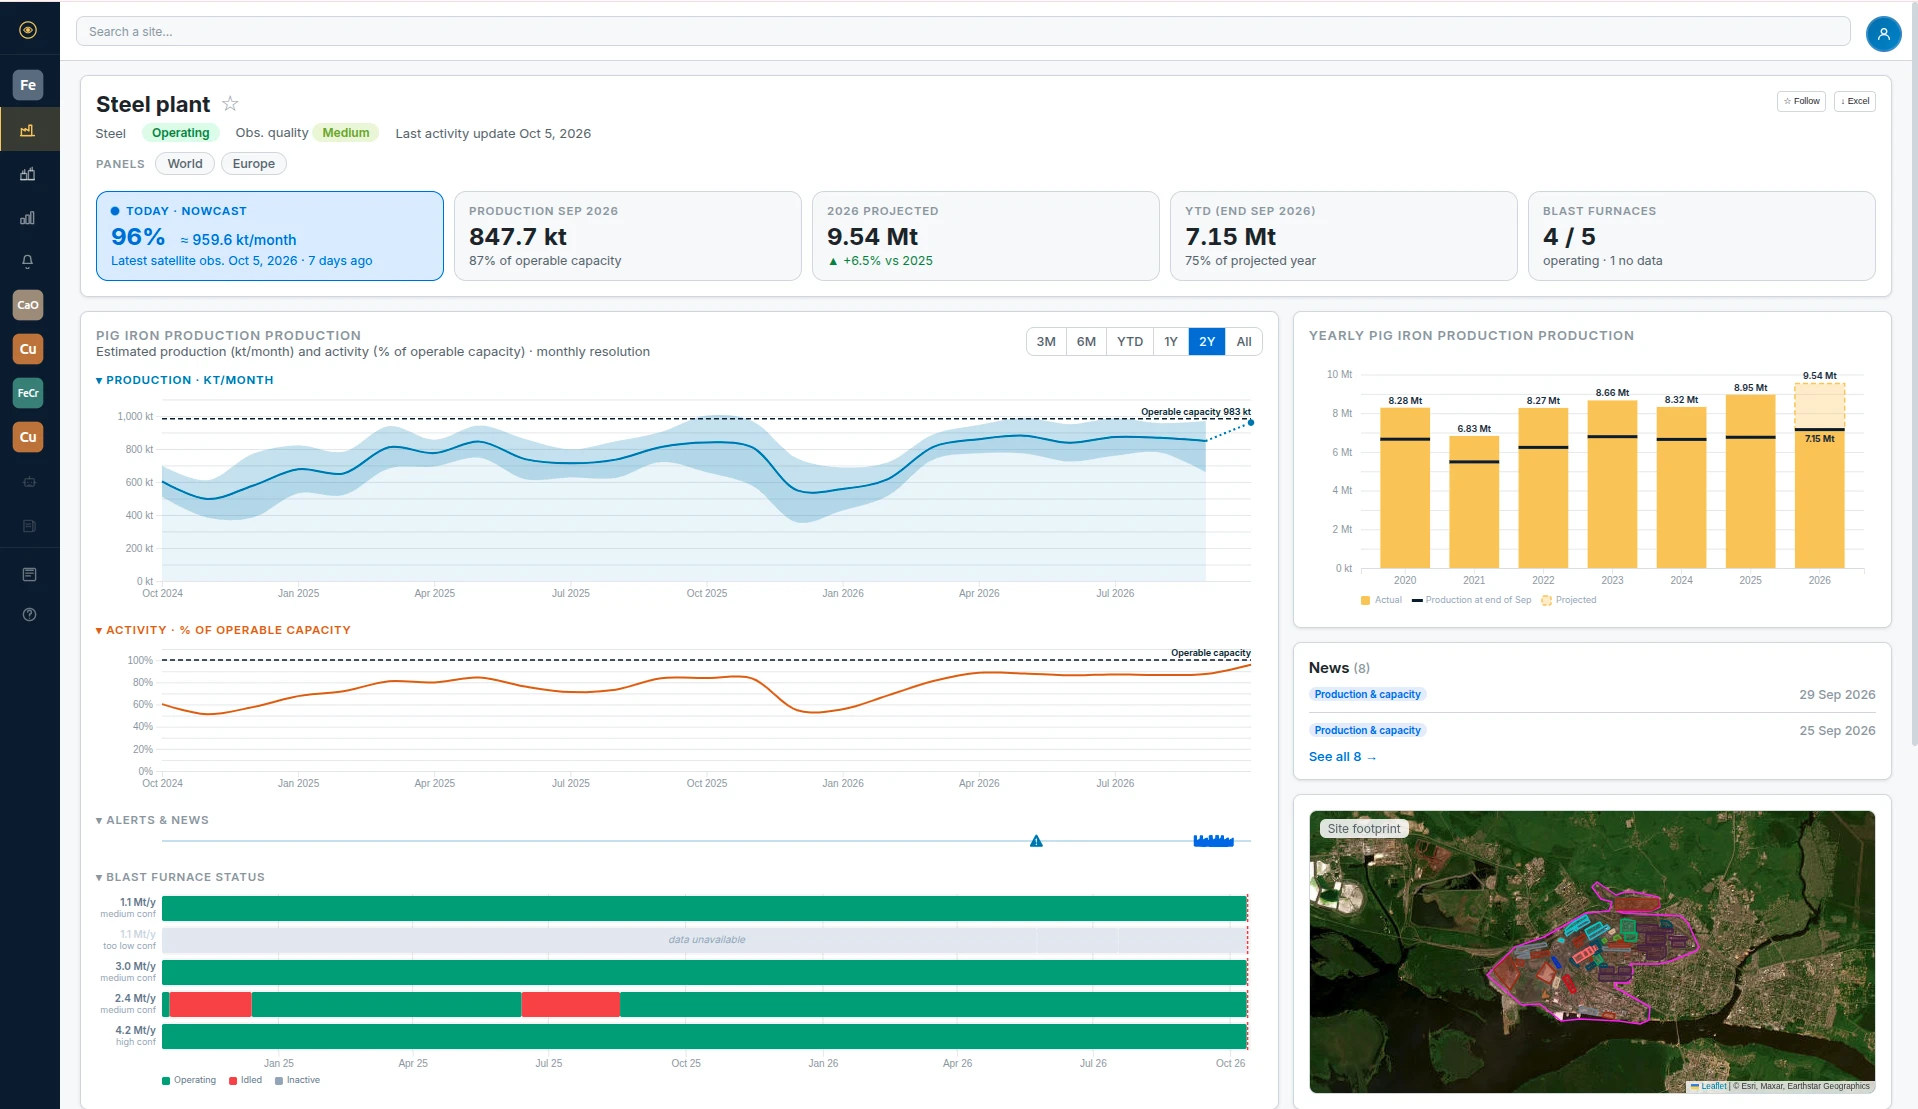
- Utilisation and production volume per site, updated between official releases
- Roll-ups by producer, country and region
- Alerts on shutdowns, slowdowns and restarts
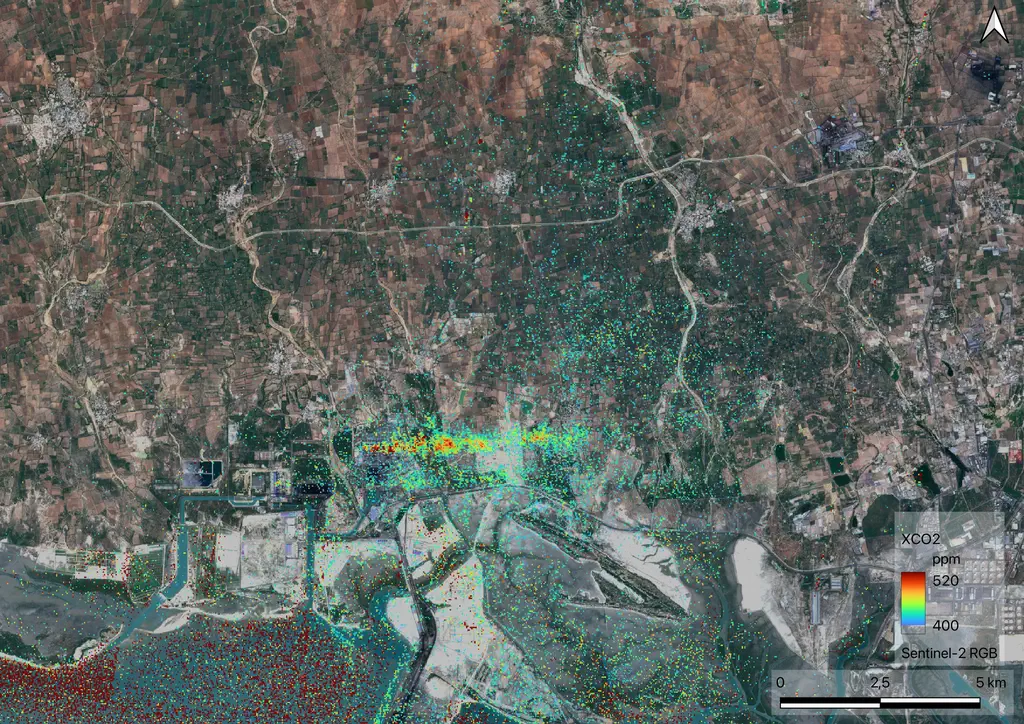
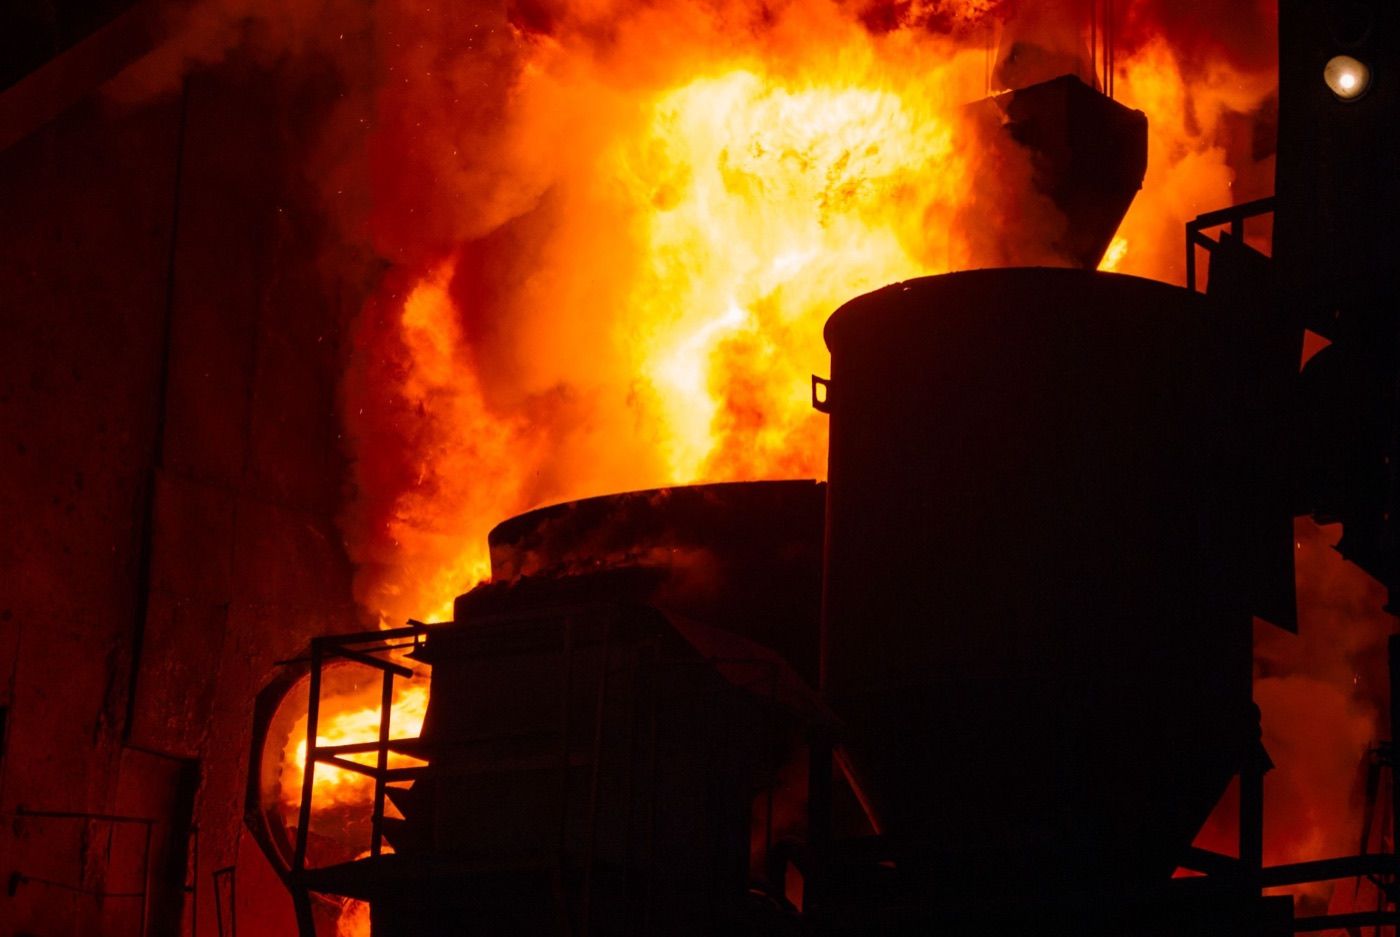
QAIrbon measures the economic and environmental performance of industrial sites from space: production, utilisation, capacity and emissions, in near real time and ahead of official figures.
4Commodities addressed
LiveSteel · CopperNextIron ore · Met coalProduct
Data Gaps
Why QAIrbon

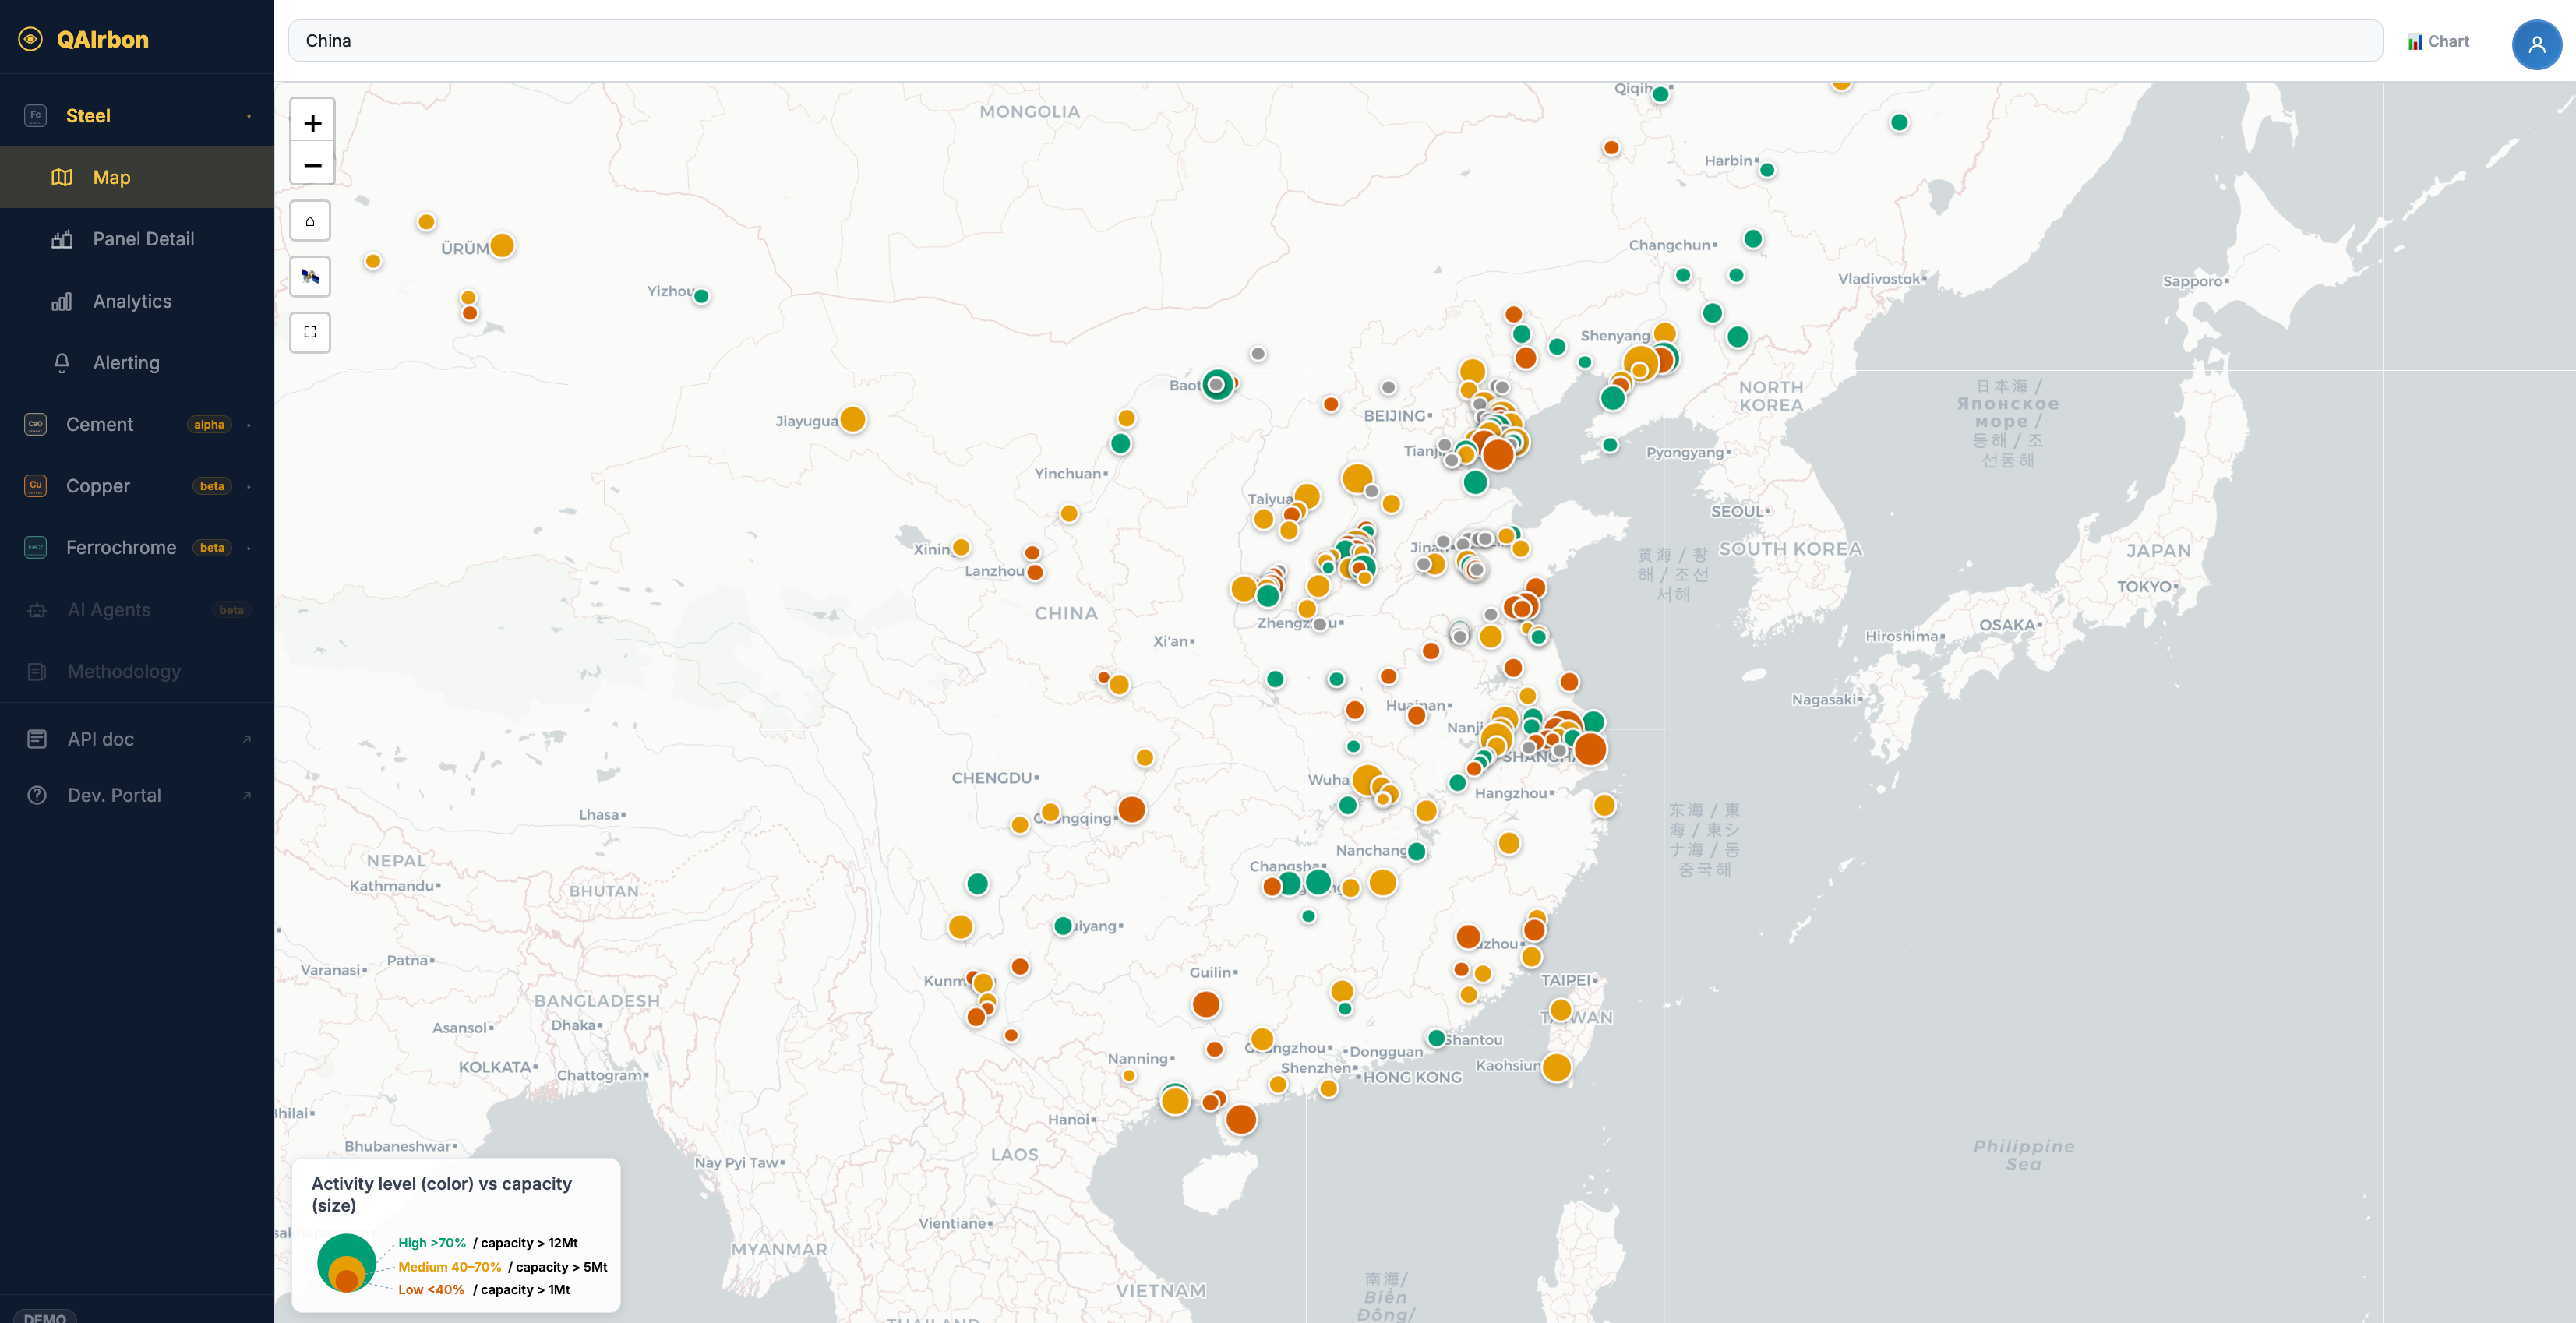
Over 500 blast furnaces and copper smelters, across six continents.
Start from a region, drill down to country, plant and producer, with or without joint ventures.

4–6 weeks ahead of official statistics. Our nowcast updates every 3–5 days.
Platform
region=EU27 · month=2026-07 · max_utilisation=754 plants in your watchlist were below 75% in July 2026:
| Plant | Utilisation | m/m |
|---|---|---|
| ArcelorMittal · Eisenhüttenstadt | 37.5% | +1.1 pt |
| Acciaierie d'Italia · Taranto | 43.9% | +2.5 pt |
| ArcelorMittal · Dunkerque | 70.6% | +0.2 pt |
| thyssenkrupp · Duisburg | 72.7% | +5.2 pt |
The two lowest have run below 60% for most of the year, so this looks structural rather than a one-off. Want me to set an alert if any of them drops another 5 points?
Monitoring
Methodology
Our production estimates are backtested against the reference statistics the market relies on.
Values are stored exactly as published on each date. Revisions are appended, so your backtests carry no look-ahead bias.
Independent validation of our CO₂ methodology is under way.
Each value carries a lower and upper bound. Cloudy months widen the band — you see it, and so does your model.
The public index
The World index is public and updated monthly, with the confidence band we publish alongside every figure. Regional, corporate and asset-level series are released to clients.
You're in. The next reading lands on the 1st.
Commodity
QAIrbon Activity Index · World
Region
The World index is public. Regional, country, corporate and asset-level series are released to clients and during a data assessment on your own coverage.
Noted. You'll get the first reading as soon as it is out.
Contact
Our team will get in touch to discuss your needs, answer your questions and show you a demo of the QAIrbon platform.
Built by scientists for commodity participants.
If you listed assets or regions, we'll come back with what we measure on them.